
BloombergNEF: China Dominates Global Clean-Tech Manufacturing Across All Five Sectors in 2024
By CII (China Industry Intel) – Contributing Analyst | June 24, 2026
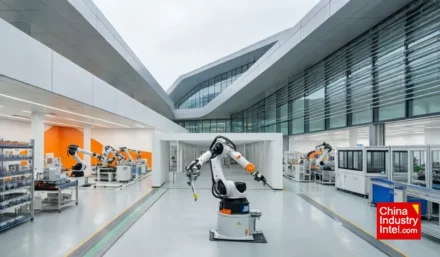
China now commands a dominant share of global manufacturing capacity across all five critical clean-technology sectors, according to BloombergNEF’s 2024 clean-tech manufacturing survey. The data reveals an unprecedented concentration of production capability that spans solar modules, lithium-ion batteries, battery metals refining, wind turbine nacelles, and hydrogen electrolyzer stacks — a position no other country or region comes close to matching. The implications for global energy security, supply chain resilience, and the pace of the energy transition are profound, prompting urgent policy responses from Washington, Brussels, and other capitals seeking to reduce their dependence on a single supplier.
BloombergNEF’s comprehensive analysis, which tracks announced and operational manufacturing capacity across the five sectors, underscores how two decades of strategic industrial policy, massive capital investment, and aggressive scaling have given China a commanding lead that will take years — if not decades — for competitors to meaningfully erode. The concentration is most extreme in solar manufacturing, where China controls up to 95% of global capacity in certain segments, but extends across the entire clean-tech value chain with shares ranging from roughly 50% for hydrogen electrolyzers to upwards of 85% for lithium-ion battery components.
The level of dependency has alarmed policymakers in the United States, European Union, Japan, India, and other nations who view clean energy supply chains through the lens of both economic competitiveness and national security. The COVID-19 pandemic’s disruption of global supply chains, Russia’s weaponization of energy exports following its invasion of Ukraine, and growing U.S.-China strategic competition have all contributed to a consensus that over-reliance on a single country for the technologies underpinning the energy transition represents an unacceptable vulnerability.
China’s Manufacturing Dominance by Sector: The BloombergNEF 2024 Data
China’s share of global manufacturing capacity varies by sector and by position in the value chain, but the overall picture is one of overwhelming dominance. The table below, based on BloombergNEF’s 2024 clean-tech manufacturing survey and supplementary industry data, breaks down China’s estimated share versus the rest of the world across all five sectors and key sub-segments.
| Sector | Key Sub-Segments | China Share (2024) | Rest of World Share | Top Non-China Producers | China Capacity (Est.) | Global Total (Est.) |
|---|---|---|---|---|---|---|
| Solar PV | Polysilicon, wafers, cells, modules | 80–95% | 5–20% | US, India, SE Asia, EU | ~900 GW (modules) | ~1,000 GW |
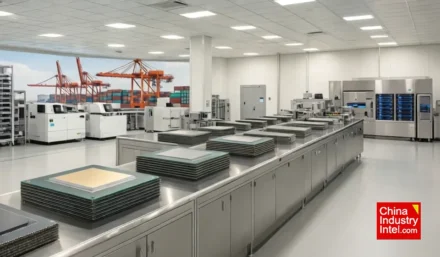
| Lithium-ion Batteries | Cells, cathodes, anodes, electrolytes, separators | 70–85% | 15–30% | South Korea, Japan, US, EU | ~1,200 GWh (cells) | ~1,600 GWh |
| Battery Metals Refining | Lithium hydroxide, cobalt sulfate, nickel sulfate, graphite | 65–75% | 25–35% | Chile, Australia, Indonesia, Finland | ~70% of global refining | — |
| Wind Turbines | Nacelle assembly, blades, towers, gearboxes | 60–70% | 30–40% | Denmark, Germany, Spain, US, India | ~100 GW (nacelles) | ~160 GW |
| Hydrogen Electrolyzers | Stack manufacturing, balance of plant | 50–60% | 40–50% | EU, US, UK, Japan, South Korea | ~25 GW | ~45 GW |
Sources: BloombergNEF Clean-Tech Manufacturing Survey 2024; IEA Energy Technology Perspectives 2024; SNE Research Global Battery Market Report; Wood Mackenzie Solar Supply Chain Analysis; GWEC Global Wind Report 2024. China share ranges reflect variation across sub-segments within each sector (e.g., China holds ~95% of wafer capacity but ~80% of module assembly). Capacity figures are rounded estimates based on announced and operational projects.
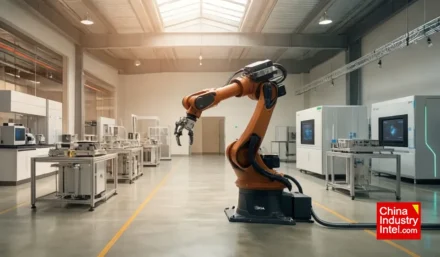
Solar PV represents the most extreme case of concentration. China’s dominance extends across every stage of the solar supply chain: approximately 80% of global polysilicon production, 95% of wafer manufacturing, 85% of solar cell production, and 80% of module assembly. The top ten solar manufacturers globally are all Chinese companies — including LONGi Green Energy, Tongwei Solar, JinkoSolar, Trina Solar, and JA Solar — which together account for over 85% of global module shipments. The United States, India, and the European Union have announced ambitious plans to build domestic solar manufacturing capacity, but current operational capacity outside China remains a fraction of what China operates, and new facilities face significant cost competitiveness challenges.
Lithium-ion batteries show a similarly lopsided distribution, though South Korea (LG Energy Solution, SK On, Samsung SDI) and Japan (Panasonic) maintain meaningful footholds in premium cell manufacturing. China’s 70-85% share encompasses not just cell production — where CATL and BYD alone account for over 55% of the global market — but extends deeper into the supply chain: China dominates production of cathodes (~80%), anodes (~85%), electrolytes (~75%), and separators (~70%). The IRA-driven battery investments in the United States and the EU’s battery gigafactory push have begun to add non-Chinese capacity, but the scale gap remains enormous.
Battery metals refining is perhaps the least visible but most strategically critical dimension of China’s dominance. Even when critical minerals are mined outside China — lithium in Australia and Chile, cobalt in the Democratic Republic of Congo, nickel in Indonesia — the refining and processing stages are overwhelmingly concentrated in China. BloombergNEF estimates that China controls approximately 65-75% of global refining capacity for lithium, cobalt, and nickel compounds used in battery manufacturing, as well as over 90% of graphite processing. This midstream chokehold means that Western efforts to diversify mining sources may prove insufficient if refining capacity remains concentrated.
Wind turbine manufacturing is the sector where China’s dominance is slightly less overwhelming but still commanding. Chinese manufacturers — led by Goldwind, Envision Energy, and Mingyang Smart Energy — control approximately 60-70% of global nacelle assembly capacity. European incumbents Vestas (Denmark), Siemens Gamesa (Spain/Germany), and Nordex (Germany) retain strong positions in certain markets and technology segments, particularly offshore wind, but Chinese manufacturers are rapidly closing the technology gap while maintaining a 20-40% cost advantage. The international expansion of Chinese wind turbine makers into markets across Asia, Africa, Latin America, and increasingly Europe is accelerating.
Hydrogen electrolyzers represent the sector where China’s lead is narrowest but growing fastest. At 50-60% of global manufacturing capacity, China’s electrolyzer industry — led by companies like LONGi Hydrogen, Sungrow Hydrogen, and PERIC — has scaled rapidly on the back of domestic demand for alkaline electrolyzers in China’s large-scale green hydrogen projects. Western manufacturers including Nel (Norway), ITM Power (UK), Thyssenkrupp Nucera (Germany), and Plug Power (US) maintain technology leads in proton exchange membrane (PEM) electrolyzers, but China’s alkaline electrolyzers are substantially cheaper and the technology gap is narrowing as Chinese companies invest in PEM and solid oxide R&D.
Why China’s Dominance Matters: Supply Chain Concentration Risk
The concentration of clean-tech manufacturing in China creates several categories of risk that are driving policy responses globally. First and foremost is supply chain vulnerability: any disruption to Chinese production — whether from geopolitical conflict, trade restrictions, natural disasters, or domestic policy shifts — would immediately impact the global availability and pricing of critical clean energy technologies. During the 2021-2022 polysilicon shortage, when a factory fire and subsequent power rationing in China disrupted solar-grade polysilicon supply, global solar module prices rose by over 20% despite underlying manufacturing overcapacity. A more severe or prolonged disruption could materially slow the pace of global decarbonization.
Second is economic dependency and leverage. When one country controls 80% or more of global supply for a critical technology, it gains structural leverage over its trading partners. China has demonstrated willingness to use export controls as a policy tool — as seen with rare earth elements, germanium, gallium, and graphite export restrictions imposed in 2023-2024 — and the extension of such measures to solar wafers, battery components, or refined battery metals would have immediate and severe impacts on clean energy deployment globally. The asymmetry creates a vulnerability that no responsible government can ignore in its energy and industrial planning.
Third is technological path dependency. China’s manufacturing scale allows it to set de facto technology standards and influence the direction of R&D investment globally. Chinese manufacturers’ decisions about which battery chemistries to scale (LFP vs. NMC), which solar cell architectures to commercialize (TOPCon vs. heterojunction), and which electrolyzer technologies to prioritize (alkaline vs. PEM) have disproportionate influence on global technology trajectories, potentially locking in suboptimal pathways from the perspective of other countries’ specific needs and circumstances.
US and EU Policy Responses: The IRA and Green Deal Industrial Plan
The policy response to China’s clean-tech manufacturing dominance has been most vigorous in the United States and European Union, though the approaches differ markedly in philosophy and mechanism.
The United States responded with the Inflation Reduction Act (IRA) of 2022, which combined production tax credits (Section 45X), investment tax credits (Section 48C), and consumer subsidies for clean energy deployment into the most ambitious industrial policy package in American history. Key manufacturing provisions include: $35 per kWh tax credit for battery cell production, with an additional $10/kWh for battery modules; $0.12 per watt for solar wafer production, $0.04/W for cells, and $0.07/W for modules; and 10% of project costs for critical mineral processing facilities. These subsidies are designed to offset China’s cost advantage and catalyze domestic manufacturing capacity. By mid-2025, the IRA had triggered over $130 billion in announced clean-tech manufacturing investments, including battery gigafactories from Panasonic, LG, SK On, and Ford, and solar manufacturing facilities from Qcells, First Solar, and several new entrants. The Department of Energy’s Loan Programs Office has further supported projects through over $40 billion in conditional loan commitments.
However, the IRA’s impact is tempered by implementation challenges: permitting delays, workforce shortages, grid interconnection bottlenecks, and the sheer time required to build competitive manufacturing capacity from a standing start. Most IRA-supported facilities will not reach full production until 2026-2028, and even then, U.S. manufacturing costs are expected to remain 20-40% above Chinese levels before subsidies — meaning the IRA’s tax credits are essential to long-term competitiveness rather than being temporary bridge support.
The European Union has pursued a multi-pronged strategy through its Green Deal Industrial Plan, the Net-Zero Industry Act (NZIA), and the European Sovereignty Fund. Key elements include: the Important Projects of Common European Interest (IPCEI) framework for state aid to clean-tech manufacturing; the Temporary Crisis and Transition Framework (TCTF) allowing member states to match subsidies offered by third countries; the European Raw Materials Act aimed at diversifying critical mineral supply chains; and carbon border adjustment mechanisms (CBAM) that indirectly penalize carbon-intensive Chinese manufacturing. The EU has set a target of manufacturing at least 40% of its clean energy technology needs domestically by 2030 — a dramatic increase from current levels where the EU imports over 90% of its solar modules and over 70% of its battery cells from China.
The results so far have been mixed. Europe’s battery manufacturing ambitions have suffered setbacks, with Britishvolt’s collapse, Freyr Battery’s strategic pivot to the US (attracted by IRA subsidies), and Northvolt’s restructuring and refocusing on its Swedish core operations. In solar, European manufacturers including Meyer Burger and REC have struggled to compete with Chinese imports despite EU anti-dumping measures and local content incentives. The EU’s more complex regulatory environment, higher energy costs, and the fragmentation of its industrial policy across 27 member states create structural disadvantages relative to both China’s centralized state capitalism and America’s unified subsidy regime.
The Cost Advantage: Why China Wins on Price
China’s dominance in clean-tech manufacturing is fundamentally rooted in a structural cost advantage estimated at 30-70% below production costs in the United States and Europe, depending on the technology. BloombergNEF’s manufacturing cost analysis identifies several reinforcing factors that create this gap:
Scale economies: Chinese factories are typically 3-5 times larger than their Western counterparts. A Chinese solar module factory might produce 20-50 GW per year compared to 2-5 GW for a typical U.S. facility. A Chinese battery gigafactory from CATL produces 50-100 GWh annually versus 10-30 GWh for new Western facilities. These scale differences translate directly into lower per-unit capital costs, higher equipment utilization rates, and greater bargaining power with upstream suppliers.
Equipment costs: China has developed a domestic clean-tech manufacturing equipment industry that supplies production lines at 40-60% lower capital cost than equivalent Western or Korean equipment. Chinese-made solar wafer furnaces, battery electrode coating machines, and electrolyzer stack assembly lines benefit from the same scale and learning-curve dynamics as the end products they produce.
Lower input costs: Industrial electricity prices in China average $0.06-0.08/kWh for large industrial users compared to $0.08-0.12/kWh in the U.S. and $0.12-0.20/kWh in the European Union. Labor costs for skilled manufacturing workers are roughly one-third to one-half of U.S. levels. Land costs in designated industrial zones — often provided by provincial governments at below-market rates as part of investment attraction packages — are a fraction of comparable sites in developed economies.
Faster construction and permitting: A large-scale battery or solar factory can be built and ramped to full production in China in 12-18 months, compared to 24-36 months in the United States and 30-48 months in Europe. The difference reflects not only regulatory streamlining but also the deep ecosystem of engineering, procurement, and construction contractors with clean-tech factory experience that has developed in China over two decades of continuous capacity expansion.
Integrated supply chains: China’s clean-tech manufacturing clusters — such as the Yangtze River Delta for solar, the Pearl River Delta and Fujian for batteries, and Inner Mongolia and Xinjiang for polysilicon — create agglomeration benefits where suppliers, equipment makers, testing facilities, and logistics networks are co-located, minimizing transportation costs and enabling just-in-time supply arrangements that Western manufacturers cannot easily replicate.
Overcapacity and Trade Friction: The Dark Side of Dominance
China’s manufacturing dominance has created a paradox: the massive capacity that gives China its cost advantage also generates chronic overcapacity that depresses global prices, squeezes margins for manufacturers everywhere, and fuels trade tensions that threaten to fragment global clean energy markets.
BloombergNEF estimates that China’s solar module manufacturing capacity of approximately 900 GW dwarfs annual global installations of roughly 400-450 GW — meaning China alone can produce roughly twice as many solar panels as the world currently installs each year. The result has been a 50% decline in solar module prices between early 2023 and mid-2025, with Chinese Tier-1 modules selling for as little as $0.10/watt. While lower module prices accelerate solar deployment globally and benefit consumers, the price collapse has driven numerous non-Chinese manufacturers out of business and made it nearly impossible for new entrants to achieve profitability without sustained government support.
In batteries, China’s cell production capacity of approximately 1,200 GWh substantially exceeds global demand of roughly 850 GWh across all applications. Battery cell prices have fallen below $50/kWh in China for LFP chemistry, a level at which only the largest manufacturers can generate profits. Second- and third-tier Chinese battery makers are failing at a rapid rate, while Western startups face an impossible competitive equation. The oversupply extends to battery materials: China’s lithium refining, cathode precursor, and graphite processing capacity all significantly exceed global demand, depressing prices throughout the value chain.
Trade friction has intensified in response. The United States has imposed: 100% tariffs on Chinese EVs; 50% tariffs on Chinese solar cells (up from 25%); 25% tariffs on Chinese lithium-ion batteries and battery parts (set to rise to 25% for non-EV batteries by 2026); and Section 301 tariffs on a range of clean-tech components. The Biden administration also tightened IRA foreign entity of concern (FEOC) rules to restrict Chinese-owned or Chinese-influenced companies from accessing IRA battery subsidies. The European Union has launched anti-subsidy investigations into Chinese EVs and wind turbines, imposed provisional anti-dumping duties on Chinese solar glass, and is considering broader trade defense measures.
These trade barriers risk fragmenting the global clean energy market into Chinese and non-Chinese spheres, potentially raising costs for consumers, slowing deployment, and creating incompatible technology ecosystems. A fully bifurcated market — where Chinese-manufactured solar panels, batteries, and wind turbines are excluded from large portions of the global market — would likely increase average clean energy system costs by 20-30% according to BloombergNEF modeling, potentially delaying the economics of clean energy deployment in developing countries that cannot afford higher equipment prices.
India, Brazil, Turkey, and other emerging economies have responded to the China dominance question with a more nuanced approach. India’s Production Linked Incentive (PLI) schemes for solar and battery manufacturing aim to build domestic capacity while simultaneously importing Chinese equipment and components where local alternatives are not yet competitive. The result is a pragmatic hybrid strategy that accepts continued Chinese technology imports in the near term while building the foundations for greater self-sufficiency over time.
Outlook: Can the World Diversify?
BloombergNEF’s analysis suggests that meaningful diversification of clean-tech manufacturing supply chains is possible but will require sustained policy commitment, substantial capital, and patience measured in years rather than quarters. The United States is on track to achieve 15-20% global market share in battery cell manufacturing by 2028, up from approximately 5% in 2023, driven by IRA subsidies. India is targeting 50 GW of domestic solar module manufacturing by 2027-2028. The European Union’s NZIA target of 40% domestic manufacturing by 2030, while ambitious, appears achievable for wind turbines and potentially batteries if current investment momentum is maintained, but significantly more challenging for solar.
However, China is not standing still. Chinese manufacturers continue to invest in capacity expansion, technology development, and international factory footprints — CATL’s Hungary plant, Gotion’s facility in Illinois, and LONGi’s planned module factory in Ohio represent efforts to bypass trade barriers by producing within protected markets. The net effect is that China’s share of global clean-tech manufacturing may modestly decline from current peaks but is unlikely to fall below majority control in any of the five sectors before 2030.
The world’s clean energy transition is therefore proceeding on a foundation of extraordinary supply chain concentration that presents both opportunities — in the form of low-cost technologies that accelerate deployment — and risks — in the form of the vulnerabilities and dependencies that concentration inevitably creates. Managing this tension will be one of the defining challenges of energy and industrial policy through the remainder of this decade.
Sources
- BloombergNEF — China Dominates Clean Energy Manufacturing Across All Sectors in 2024
- International Energy Agency (IEA) — Energy Technology Perspectives 2024: Clean Energy Manufacturing Outlook
- IEA — Advancing Clean Technology Manufacturing: An Energy Technology Perspectives Special Report (2024)
- U.S. Department of Energy — IRA Section 45X Advanced Manufacturing Production Tax Credit
- European Commission — The Green Deal Industrial Plan
- Wood Mackenzie — Solar Supply Chain Analysis 2024: China’s Continuing Dominance
- Global Wind Energy Council (GWEC) — Global Wind Report 2024
- SNE Research — Global EV Battery Market Share and Capacity Report 2024
- Reuters — China’s clean-tech overcapacity fuels global trade tensions (2024)
- Financial Times — The world’s dangerous dependence on China’s clean energy factories (2024)
- Center for Strategic and International Studies (CSIS) — China’s Clean Energy Manufacturing Dominance: Implications and Responses (2024)
- Bruegel — The European Union’s Clean-Tech Manufacturing Strategy: Ambitions and Realities (2024)