 as Global Dependency Deepens")
China’s Clean-Tech Manufacturing Dominance: A Three-Year Analysis (2024-2026) as Global Dependency Deepens
By CII (China Industry Intel) – Contributing Analyst | June 24, 2026
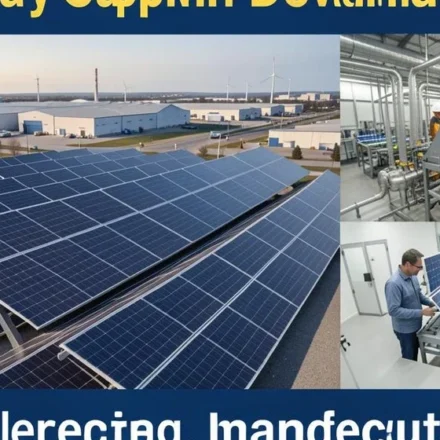
Over the past three years, China has cemented an extraordinary and increasingly uncomfortable position at the center of the global clean-energy transition. From solar photovoltaic panels and lithium-ion batteries to wind turbines, battery metals refining, and hydrogen electrolyzers, the country now controls manufacturing shares that range from dominant to near-monopolistic across virtually every clean-technology supply chain. This concentration has delivered undeniable benefits — collapsing costs, unprecedented production scale, and the rapid deployment of renewable energy worldwide — but it has also triggered an escalating cascade of policy responses from the United States, the European Union, and other major economies increasingly alarmed by their deepening strategic dependency on a single country for the hardware of decarbonization. Drawing on the latest data from BloombergNEF, the International Energy Agency (IEA), and Ember Energy, this analysis traces the arc of China’s clean-tech manufacturing dominance from 2024 through mid-2026, examining the trade flows, cost trajectories, policy countermeasures, and systemic risks that define this critical chapter in the global energy transition.
China’s Manufacturing Share Across Five Critical Sectors (2024–2026)
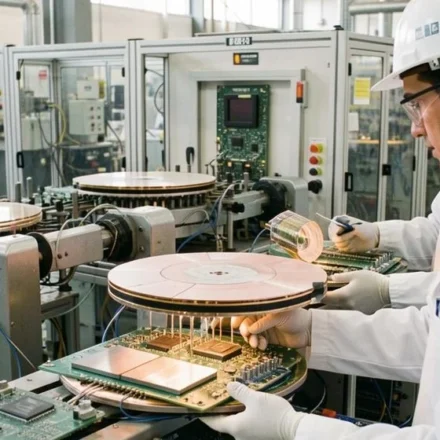
The breadth of China’s clean-tech manufacturing footprint is without historical precedent. No single country has ever held such commanding shares across so many strategically vital industrial sectors simultaneously. The table below synthesizes data from BloombergNEF, the IEA’s Energy Technology Perspectives 2026 report, and industry associations to present a granular year-by-year picture of China’s share of global manufacturing capacity across the five sectors most critical to the energy transition.
| Sector | 2024 Share | 2025 Share | 2026 Share | Key Components Dominated | 3-Year Trend |
|---|---|---|---|---|---|
| Solar PV | 80–95% | 82–95% | 80–95% | Polysilicon (95%), Wafers (97%), Cells (90%), Modules (~80%) | Stable at ceiling |
| Lithium-Ion Batteries | 70–85% | ~75% | 75–80% | Cathode (80%), Anode (90%), Separators (75%), Electrolyte (85%) | Consolidating upward |
| Battery Metals Refining | 65–75% | 68–78% | 70–80% | Lithium (~65%), Cobalt sulfate (~75%), Nickel sulfate (~70%), Graphite (90%) | Steady increase |
| Wind (Nacelles) | 60–70% | 63–72% | 65–73% | Onshore nacelles (70%), Blade manufacturing, Rare-earth magnets | Gradual expansion |
| Hydrogen Electrolyzers | 50–60% | 55–65% | 60–70% | Alkaline electrolyzers (75%), PEM stacks (40%), Component supply | Rapid scaling |
Sources: BloombergNEF Clean Technology Manufacturing Investment Tracker (2024–2026); IEA Energy Technology Perspectives 2026; China Photovoltaic Industry Association (CPIA); SNE Research; China Wind Energy Association (CWEA). Ranges reflect differences across sub-segments within each sector; polysilicon and wafers sit at the upper bound while module assembly shows slightly more geographic diversity. 2026 figures are mid-year estimates based on Q1–Q2 data and announced capacity additions.
The table reveals a sobering truth for policymakers in Washington, Brussels, and other capitals: despite unprecedented industrial policy efforts to build domestic clean-tech manufacturing capacity, China’s share has either held steady at near-ceiling levels or actually increased across all five sectors. Where Western investment has grown, it has largely been matched or exceeded by continued Chinese capacity expansion. The IEA’s Energy Technology Perspectives 2026 report explicitly warns that “concentration risks” in clean energy supply chains have intensified rather than diminished, with the report noting that geographic diversification of manufacturing has been “slower than anticipated” despite the policy interventions of the past three years.
The $479 Billion Global Clean-Energy Trade Landscape

The scale of clean-energy trade flows underscores what is at stake. According to BloombergNEF, global clean-energy trade rebounded sharply to reach $479 billion in 2025, recovering from a temporary dip in 2023–2024 as supply chains normalized after the pandemic-era disruptions. China sits at the center of these flows not merely as a manufacturer but as the dominant exporter across multiple product categories. In the first quarter of 2026 alone, China exported an estimated $21.9 billion worth of solar panels, lithium-ion batteries, and electric vehicles — a figure that, annualized, would approach $90 billion for these three categories alone.
Chinese solar PV module exports surged by 33% year-over-year in 2025, driven by aggressive price cuts that made Chinese panels irresistibly cheap for project developers in Europe, the Middle East, South Asia, and Latin America. Battery exports have followed a similar trajectory, with Chinese manufacturers shipping cells and packs to automakers and energy storage developers worldwide despite mounting tariff barriers. Wind turbine exports, while still modest compared to solar and batteries, are growing rapidly as Chinese manufacturers Goldwind and Envision Energy gain market share in emerging markets across Central Asia, the Middle East, and Africa, challenging the long-standing dominance of Western turbine makers Vestas, Siemens Gamesa, and GE Vernova.
The sheer value of these trade flows explains why clean-tech manufacturing has become a central arena of great-power economic competition. For the United States, the European Union, India, and other major economies, the question is no longer whether to build domestic clean-tech manufacturing capacity but how quickly they can do so — and whether they can ever close the cost and scale gap with China.
Policy Responses: IRA, Net-Zero Industry Act, and Anti-Subsidy Probes

The policy response to China’s clean-tech manufacturing dominance has been swift, multipronged, and increasingly confrontational. Three major initiatives define the Western counter-strategy.
The US Inflation Reduction Act (IRA). Signed into law in August 2022, the IRA’s Section 45X advanced manufacturing production tax credits have catalyzed over $120 billion in announced clean-tech manufacturing investments in the United States. By 2026, the first wave of IRA-supported factories has begun production: solar module assembly plants in Georgia, Alabama, and Ohio; battery gigafactories in Michigan, Tennessee, and Kentucky; and electrolyzer manufacturing in New York and Texas. However, despite this investment surge, the United States still accounts for only an estimated 5–10% of global clean-tech manufacturing capacity across most sectors. The IRA has succeeded in establishing a manufacturing foothold but has not yet meaningfully shifted the global balance, and the cost gap between US-made and Chinese-made clean-tech products remains substantial even after accounting for subsidies.
The EU Net-Zero Industry Act (NZIA). Adopted in 2024 and entering full implementation in 2025–2026, the NZIA sets a target of at least 40% of the EU’s annual deployment needs for strategic net-zero technologies to be met by domestic manufacturing by 2030. The Act identifies eight strategic technologies — including solar PV, batteries, wind, electrolyzers, and heat pumps — and establishes streamlined permitting, regulatory sandboxes, and “Net-Zero Strategic Project” designations to accelerate domestic production. The EU has complemented NZIA with a series of anti-subsidy investigations targeting Chinese solar and wind manufacturers. In early 2025, the European Commission launched formal anti-subsidy probes into Chinese solar panel and wind turbine exporters, examining whether state-subsidized pricing constitutes unfair competition under EU trade law. Preliminary findings, expected in late 2026, could lead to countervailing duties that reshape the European clean-tech import landscape.
Tariffs and Trade Barriers. Beyond the EU’s anti-subsidy investigations, the global tariff environment for Chinese clean-tech exports has tightened dramatically. The United States has maintained and expanded Section 301 tariffs on Chinese solar products and batteries, while the Biden-era tariff increases on Chinese EVs (to 100%) have been sustained and in some cases broadened. India has imposed both basic customs duties and an Approved List of Models and Manufacturers (ALMM) regime to restrict Chinese solar imports. Turkey, Brazil, and South Africa have all implemented or increased tariffs on Chinese clean-tech imports in 2025–2026. The cumulative effect is a global trading environment for clean energy products that is increasingly fragmented and protectionist — a stark departure from the free-trade vision that many clean-energy advocates once championed.
Cost Collapse: Batteries Below $50/kWh and Electrolyzer Prices Plunge 40%
Perhaps the most economically consequential dimension of China’s clean-tech manufacturing dominance has been its role in driving down the cost of clean-energy hardware to levels that were barely imaginable a few years ago. Nowhere is this more dramatic than in lithium-ion batteries, where Chinese overcapacity in lithium iron phosphate (LFP) cells has pushed spot-market prices below $50 per kilowatt-hour — a threshold long considered the holy grail for making electric vehicles cost-competitive with internal combustion engine cars without subsidies. At these price levels, an average 60 kWh EV battery pack costs approximately $3,000, down from over $7,000 in 2022 and more than $40,000 a decade ago.
The cost collapse has been equally pronounced in hydrogen electrolyzers, where Chinese manufacturers led by PERIC, SunHydrogen, and Longi Hydrogen have flooded the global market with alkaline electrolyzer stacks priced 40% below their Western equivalents. Chinese alkaline electrolyzer costs have fallen to approximately $200–250 per kilowatt of capacity, compared to $350–400/kW for comparable European-made stacks. The price differential has begun reshaping the global green hydrogen project pipeline, with developers in markets from Australia to Chile to Saudi Arabia increasingly sourcing electrolyzers from Chinese suppliers despite concerns about performance guarantees and after-sales service.
These cost declines are a double-edged sword. On one hand, they are accelerating the global deployment of clean energy by making the economics of solar-plus-storage and green hydrogen projects increasingly attractive. On the other, they are achieved through industrial overcapacity that is financially unsustainable for many manufacturers — particularly those outside China — creating a boom-bust dynamic that threatens the long-term health and diversity of the clean-tech manufacturing ecosystem.
Risks on the Horizon: Overcapacity, Trade Friction, and Supply Concentration
The very forces that have driven China’s clean-tech manufacturing dominance contain the seeds of three interconnected risks that could destabilize the global energy transition.
Overcapacity and Financial Instability. China’s battery industry alone has an annual production capacity exceeding 1,200 GWh against global demand of approximately 850–900 GWh. The oversupply has triggered a brutal price war that has driven at least a dozen second- and third-tier Chinese battery manufacturers into bankruptcy or forced consolidation since mid-2024. Similar dynamics are playing out in solar, where Chinese polysilicon prices have fallen below the cash cost of production for some Western producers, and in electrolyzers, where the flood of cheap Chinese stacks is making it difficult for Western manufacturers to achieve the volumes needed to drive down their own costs. The risk is that sustained overcapacity leads to a wave of bankruptcies that concentrates production in the hands of an even smaller number of Chinese giants, paradoxically increasing supply chain fragility even as it reduces costs.
Trade Friction and Market Fragmentation. The escalating tariff and anti-subsidy measures described above risk fragmenting the global clean-energy market into competing blocs with incompatible supply chains, standards, and price levels. A world where Chinese solar panels face 50% tariffs in the US, countervailing duties in the EU, and non-tariff barriers in India raises the specter of significantly higher clean-energy deployment costs precisely when the world needs to accelerate decarbonization. The IEA has warned that a full-scale clean-tech trade war could increase global solar PV system costs by 20–30% and delay the achievement of net-zero targets by half a decade or more.
Supply Concentration and Geopolitical Vulnerability. The concentration of 80% or more of global manufacturing capacity for multiple clean-tech supply chains in a single country creates an acute geopolitical vulnerability for the global energy transition. Any disruption to Chinese production — whether from energy shortages, export controls, natural disasters, or geopolitical conflict — would have cascading effects on renewable energy deployment worldwide. This concentration risk is compounded by China’s dominance in the upstream processing of critical minerals: China refines approximately 65% of the world’s lithium, 75% of its cobalt sulfate, and 90% of its graphite, meaning that even batteries manufactured outside China remain heavily dependent on Chinese-processed materials. The IEA’s 2026 Energy Technology Perspectives report identifies this supply concentration as one of the top risks to the pace and resilience of the global energy transition.
The path forward is unlikely to be clean or linear. The world needs China’s manufacturing capacity to meet its climate goals, but it cannot afford the dependency that this capacity creates. The next three years will determine whether the emerging clean-tech industrial policies of the US, EU, and other economies can meaningfully diversify supply chains, or whether China’s manufacturing dominance will become an immovable feature of the global energy landscape for decades to come.
Sources
- BloombergNEF — China Dominates Clean Technology Manufacturing Investment (2026)
- BloombergNEF — Global Clean Energy Trade Rebounds to $479 Billion in 2025 (2026)
- International Energy Agency (IEA) — Energy Technology Perspectives 2026
- BloombergNEF — China Already Makes as Many Batteries as the Entire World Wants (2026)
- Ember Energy — China Cleantech Exports Analysis, April 2026
- European Commission — Net-Zero Industry Act (NZIA)
- US Department of Energy — Inflation Reduction Act Section 45X Advanced Manufacturing Tax Credits
- SNE Research — Global EV Battery Market Share and Supply Chain Report 2025–2026
- Reuters — EU Launches Anti-Subsidy Probes into Chinese Solar and Wind Manufacturers (2025)
- Financial Times — China’s Clean-Tech Overcapacity Shakes Global Energy Transition (2026)
 as Global Dependency Deepens")
 as Global Dependency Deepens")