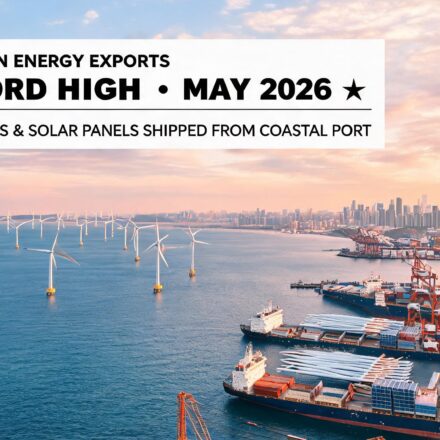

China Clean Energy Exports Hit Record in May 2026
China Clean Energy Exports Hit Record $38.6 Billion in May 2026 as Solar, EV and Battery Surge Accelerates
Hook: China’s clean energy exports surged to a record $38.6 billion in May 2026, up 42.3% year-on-year, driven by unprecedented shipments of solar panels, electric vehicles, and lithium-ion batteries. The clean energy sector now accounts for nearly 8% of China’s total exports — up from 5.1% a year ago — and is emerging as the single most powerful engine behind the country’s broader 19.4% overall export growth reported for the same month. As Western tariffs tighten on individual product categories, Chinese manufacturers are responding not by retreating, but by diversifying markets, integrating vertically, and driving costs down to levels that competitors on three continents describe as “unsustainable.”
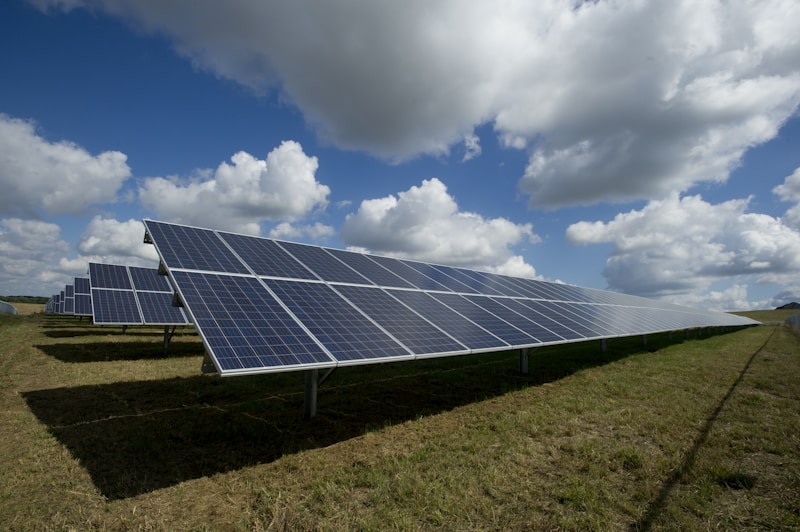
Photo by American Public Power Association on Unsplash
What Happened — A Record Month Across Every Clean Energy Category
Customs data released by China’s General Administration of Customs on June 15 shows that May 2026 marked the highest monthly clean energy export value in the country’s history. The $38.6 billion figure represents a 42.3% increase over May 2025 and a 12.7% jump from the previous record of $34.3 billion set in March 2026. The three dominant categories — solar photovoltaic modules, electric vehicles, and lithium-ion batteries — each set individual monthly records.
Solar panel exports reached $14.2 billion in May, up 38.1% year-on-year, as Chinese manufacturers shipped 31.4 gigawatts of module capacity to markets across Southeast Asia, the Middle East, Latin America, and Africa. The surge reflects both aggressive pricing — average module prices fell to $0.098/watt, breaching the $0.10/watt threshold for the first time — and a pull-forward effect as importers in the EU and India accelerated purchases ahead of anticipated tariff increases in H2 2026.
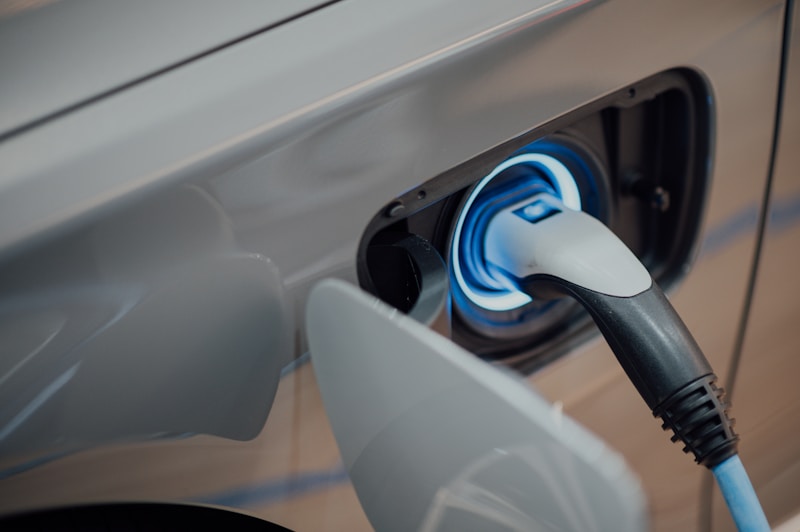
EV exports — including battery electric vehicles, plug-in hybrids, and electric buses — reached $12.8 billion, up 51.6% year-on-year. BYD alone accounted for $4.1 billion of the total, followed by Chery ($1.6 billion), SAIC ($1.3 billion), and Geely ($1.1 billion). Notably, exports to markets outside the EU and the US grew by 67%, as Chinese brands accelerated expansion into the Middle East, Southeast Asia, Latin America, and Africa — regions where tariff barriers remain lower and brand recognition is growing rapidly.
Lithium-ion battery exports totaled $11.6 billion, up 39.2% year-on-year, driven by demand from global automakers, energy storage system integrators, and consumer electronics manufacturers. CATL, BYD, and EVE Energy collectively accounted for 62% of total battery export value.
Why It Matters — Clean Energy Is Now a Structural Export Pillar
The May data confirms that clean energy is no longer a niche export category for China — it is a structural pillar of the country’s trade surplus. In the first five months of 2026, clean energy exports totaled $162.4 billion, up 44.8% from the same period in 2025 and already equal to 68% of the full-year 2024 total. At the current run rate, 2026 clean energy exports are on track to exceed $380 billion — a figure that would surpass the entire GDP of most individual countries.
The growth is particularly significant because it is accelerating even as the US, EU, and India have imposed or announced new tariffs on Chinese clean energy products. The US doubled tariffs on Chinese solar cells to 50% in January 2026, while the EU imposed countervailing duties of 17.4% to 38.1% on Chinese EVs in October 2025. Yet total Chinese clean energy exports to these markets fell by only 11% in May, while exports to the rest of the world surged by 73% — more than offsetting the tariff-driven decline.
Clean Energy Export Breakdown — May 2026 vs. May 2025
| Category | May 2025 | May 2026 | YoY Change | Key Driver |
|---|---|---|---|---|
| Solar PV Modules | $10.3B | $14.2B | +38.1% | Price drop to $0.098/W; MENA & LatAm demand surge |
| Electric Vehicles | $8.4B | $12.8B | +51.6% | BYD expansion; 67% growth in non-Western markets |
| Lithium-ion Batteries | $8.3B | $11.6B | +39.2% | Global EV adoption; grid-scale ESS demand |
| Wind Turbines & Components | $1.5B | $2.1B | +40.0% | Offshore wind expansion in SE Asia & Brazil |
| Heat Pumps | $1.1B | $1.5B | +36.4% | EU decarbonization mandates; price competitiveness |
| Total Clean Energy Exports | $27.1B | $38.6B | +42.3% | All categories at record levels |
Sources: China General Administration of Customs, Bloomberg NEF, China Photovoltaic Industry Association, China Association of Automobile Manufacturers. EV figures include BEV, PHEV, and electric buses. Battery figures include cells, packs, and ESS modules.
Key Players — The Companies Driving the Surge
BYD remains the single largest contributor to China’s clean energy export boom, with combined EV and battery exports of $6.8 billion in May — 17.6% of the total. The company’s vertical integration strategy, which spans battery cells, power electronics, and vehicle manufacturing, gives it a cost advantage that European and Japanese competitors describe as “structurally insurmountable” at current price points.
CATL exported $3.9 billion in battery products in May, maintaining its position as the world’s largest battery manufacturer with a 37.4% global market share. The company’s new sodium-ion battery production line in Yibin began commercial shipments in April 2026, targeting the budget EV and stationary storage segments where lithium-iron-phosphate chemistry is being supplemented by lower-cost alternatives.
LONGi Green Energy and Trina Solar together accounted for $5.1 billion in solar module exports, as the industry’s shift toward n-type TOPBC and heterojunction cell architectures continues to drive efficiency gains that sustain Chinese manufacturers’ lead over competitors in Southeast Asia and India.
Strategic Implications — The Tariff Paradox
The May export data exposes a central paradox in Western trade policy: tariffs on Chinese clean energy products are rising, but total Chinese clean energy exports are rising faster. The reason is geographic diversification. Chinese manufacturers have spent the past 18 months building distribution networks, assembly facilities, and financing arrangements in markets that are not subject to Western tariff regimes.
BYD’s new assembly plant in Turkey, which began trial production in April 2026, will allow the company to sell “Made in Turkey” EVs into the EU at preferential tariff rates. CATL’s battery plant in Hungary, which reached 20 GWh capacity in Q1 2026, similarly positions the company inside the EU tariff wall. Meanwhile, Chinese solar manufacturers have shifted final assembly of modules to Vietnam, Malaysia, Indonesia, and Morocco — creating a complex web of origin-country diversification that makes country-of-origin tariffs difficult to enforce.
The deeper implication is that China’s clean energy export dominance is becoming self-reinforcing. Scale drives down unit costs, which drives further adoption, which drives further scale. The $0.098/watt solar module price achieved in May is 47% below the average production cost of non-Chinese manufacturers. In EVs, BYD’s average export price of $18,400 per vehicle is 38% below the average European BEV price. These cost advantages are not the product of subsidies alone — they reflect structural advantages in supply chain integration, manufacturing automation, and domestic market scale that tariffs alone cannot neutralize.
Market Signal — Three Scenarios for H2 2026
Bull Case: Clean energy exports maintain the May run rate and reach $400+ billion for full-year 2026. The EU and US fail to close tariff circumvention loopholes, and Chinese manufacturers capture 75%+ of global solar, 35%+ of global EV, and 55%+ of global battery exports. Clean energy becomes China’s largest single export category by value.
Bear Case: Tariff enforcement tightens significantly in H2 2026, particularly around rules-of-origin for solar modules assembled in Southeast Asia. EU anti-circumvention investigations into Vietnamese and Malaysian solar transshipment lead to a 15-20% pullback in export volumes. The sector’s contribution to overall export growth moderates, and investors begin pricing in the risk of a broader trade war escalation.
Base Case: Clean energy exports continue growing at 30-35% year-on-year, reaching $360-380 billion for full-year 2026. Tariff circumvention through geographic diversification continues to offset direct tariff impacts. The structural cost advantage of Chinese manufacturers widens further as automation and scale effects compound. The sector becomes a permanent, high-weight component of China’s export portfolio — comparable in strategic significance to electronics and machinery.
What to watch: Three developments will shape the H2 trajectory. First, the EU’s preliminary ruling on anti-circumvention investigations into Southeast Asian solar transshipment, expected in August 2026. Second, the pace of BYD’s European assembly strategy — if the Turkey plant reaches full capacity by Q4, it could add $2-3 billion in annualized EU-bound EV exports. Third, the US presidential election in November, where a change in administration could alter the tariff calculus entirely. The outcome will also signal whether China’s EV supply chain dominance is a transitional phenomenon driven by subsidies or a permanent structural shift in global manufacturing.
CII Analysis
May 2026’s record clean energy export figures confirm that China’s dominance in solar, EVs, and batteries is not merely a function of subsidies — it is a structural advantage rooted in supply chain integration, manufacturing scale, and relentless cost reduction. The 42.3% year-on-year growth in a single month, achieved in the face of escalating tariffs from the US, EU, and India, demonstrates that trade barriers alone cannot offset a 40-50% cost advantage that is embedded in the production process itself.
The geographic diversification strategy is particularly significant. Chinese clean energy manufacturers are no longer dependent on any single export market. Exports to non-Western markets grew by 73% in May, driven by surging demand in the Middle East (particularly Saudi Arabia and the UAE for solar), Southeast Asia (Thailand, Indonesia, and the Philippines for EVs), and Latin America (Brazil and Mexico for batteries and solar). This diversification reduces the tariff risk that has dominated investor concerns since 2024.
Our assessment: China’s clean energy export dominance is becoming structurally entrenched and will persist regardless of tariff policy in Western markets. The combination of cost leadership, geographic diversification, and upstream supply chain control — China produces 80%+ of the world’s solar wafers, 75%+ of lithium-ion battery cells, and 60%+ of EV battery-grade lithium processing — creates a competitive moat that tariffs can slow but not reverse. For global investors and policymakers, the strategic question is no longer whether China will dominate clean energy manufacturing, but how to build competitive alternatives at scale.
For deeper analysis on China’s EV ecosystem and supply chain dynamics, see our China EV Supply Chain pillar page and our coverage of BYD’s Global Expansion.
Further Reading:
- China EV Supply Chain — Full Analysis
- CATL Sodium-Ion Battery Mass Production Begins
- China Solar Dominance: The $0.10/Watt Milestone
- EU-China EV Tariffs: One Year Later
Sources
- China General Administration of Customs — May 2026 Trade Data Release (June 15, 2026)
- Bloomberg NEF — China Clean Energy Export Tracker Q2 2026
- International Energy Agency — Global EV Outlook 2026
- Reuters — China’s May Exports Surge 19.4% as Clean Energy Leads Growth (June 15, 2026)
- South China Morning Post — BYD and CATL Drive Record Chinese Clean Energy Exports (June 16, 2026)
- PV Magazine — Chinese Solar Module Prices Breach $0.10/Watt Barrier (June 14, 2026)